Biology-Specific Features
Clustergrammer was developed to visualize high-dimensional biological data (e.g. genome-wide expression data), but it can also generally be applied to any high-dimensional data. Clustergrammer has several biology-specific features that facilitate the analysis of gene-level biological data, such as: gene expression data, proteomics-data, etc. To take advantage of these features, row names must be official gene names. See the CCLE Explorer for examples of visualizing gene expression data. These optional biology-specific features are available in the Clustergrammer-Web as well as the Clustergrammer-Widget and will automatically activate if the row-names are genes.
Mouseover Gene Name and Description
The human genome consists of over 20,000 genes and modern high-throughput measurements are capable of making measurements across the entire genome (e.g. genome-wide expression studies). Human genes have official gene symbols (e.g. EGFR) that are frequently used to label genes in these datasets. Since no biologist can be knowledgeable about every gene in the genome a common and repetitive task is looking up the names and descriptions of genes in a dataset or visualization. To streamline this activity, Clustergrammer automatically displays the full name and description of a gene (provided by data aggregated through the Harmonizome) as a tooltip when a user mouses over a gene label (see screenshot below). This simple feature speeds up analysis of large gene-level datasets.
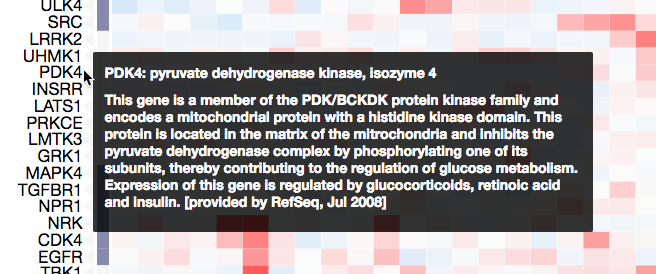
Mousing over a gene name row brings up the full gene name and description (provided by data aggregated through the Harmonizome).
The JavaScript file hzome_functions.js provides this functionality by utilizing Harmonizome’s RESTful API to obtain gene names and descriptions on mouseover events. hzome_functions.js is passed to Clustergrammer-JS as a callback function. See load_clustergram.js for an example use case. Mouseover callback functions can be used by developers to extend functionality for other domain-specific problems.
Enrichment Analysis
The field of biology has amassed an enormous amount of information about the genes in living organisms such as: function, disease-association, up-stream regulators, protein-level binding partners, etc. Integration of this information can help biologists understand patterns in their data. For instance, enrichment analysis is a popular method to identify biological information specific to a list of genes – e.g. a biologist can use enrichment analysis to identify up-stream regulatory transcription factors that specifically target their a set of up-regulated genes and thereby form hypotheses about potential up-stream regulators.
Export to Enrichr
When a user visualizes a matrix with genes as rows, Clustergrammer automatically enables integration with the enrichment analysis tool Enrichr. Users can export a set of clustered genes to Enrichr using the interactive dendrogram (see screenshot) or import enriched terms into the visualization using the Enrichrgram functionality.
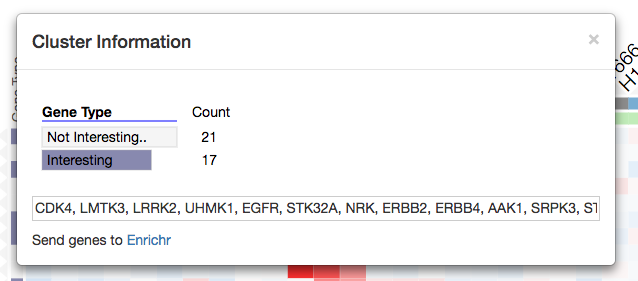
Clicking a row dendrogram cluster opens a modal window with cluster information, row names, and a ‘Send genes to Enrichr’ link that allows users to export their gene list (e.g. cluster of row-genes) to Enrichr.
Enrichrgram
Enrichrgram enables users to find biological information specific to their genes of interest (using Enrichr) and import this information directly into the visualization as row categories (see screenshot below). Enrichrgram can be run on the front or back end (using the Clustergrammer-PY API to pre-calculate results). This feature enables enrichment analysis to be performed within the visualization itself by both the original author of the visualization and subsequent viewers.
Enrichrgram Front End
Enrichrgram on the front end is available to anyone viewing the visualization and can be used by simply clicking the red DNA-like Enrichr logo on the top left of the heatmap, which brings up a list of Enrichr libraries to choose from. To perform enrichment analysis, choose a library and Enrichrgram will return enriched terms from this library that are specifically associated with your list of genes (P-value bars indicate the degree of specificity). For instance, clicking on ChEA 2016 will calculate enrichment for up-stream transcription factors. The enriched terms are shown as row categories, which enables users to see which genes are associated with each term. Row-category titles show the enriched term and the red-bars represent the significance of the enrichment (see Enrichr combined score). Users can run enrichment analysis on a specific cluster of genes by filtering the matrix to only show only their genes of interest. This filtering can be done using the Dendrogram Crop buttons (see Interactive Dendrogram) or Brush-Crop button (see Cropping) to select a subset of genes for analysis.
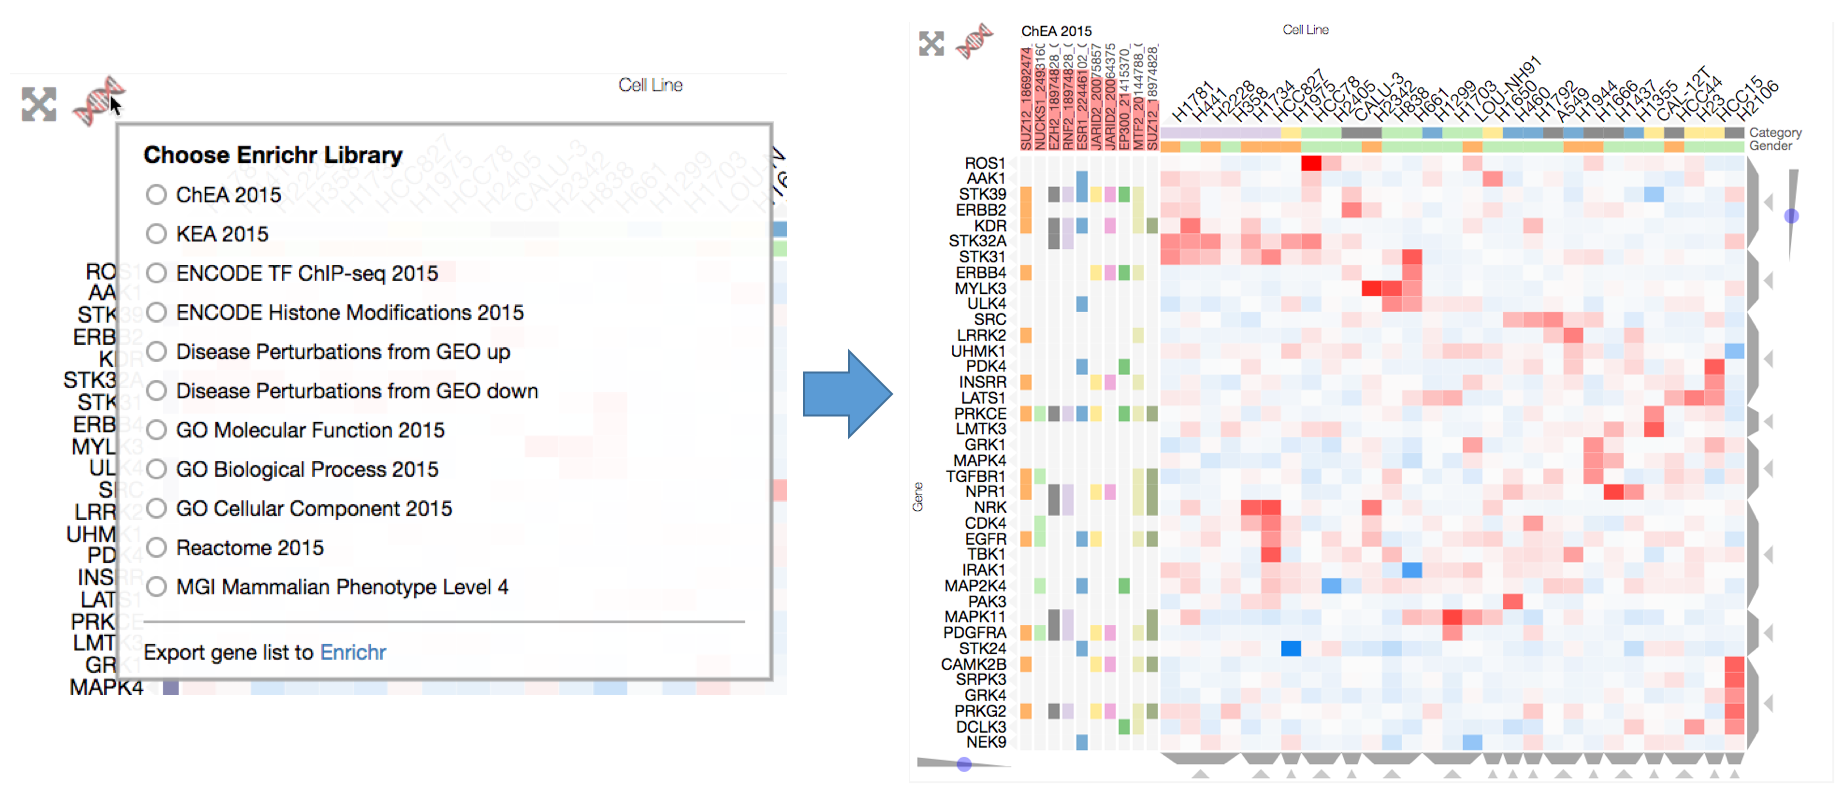
Users can perform enrichment analysis to find biological information specific to their genes (e.g. a cluster of genes). Users can select from several enrichment libraries, and the top 10 enriched terms will be shown as rows categories. The combined scores for the enriched terms will be shown as red bars behind the row category titles.
Note that Enrichrgram results run on the front end are not permanent and will be lost after refreshing the page, but the matrix with enrichment results can be downloaded using the Download Icon button. Enrichment results can be permanently added to the visualization from the back end using the enrichgram method described below.
Enrichrgram Back End
To permanently add pre-calculated enrichment results to a visualization run the enrichrgram method described in the Clustergrammer-PY API before clustering. The Jupyter notebook Clustergrammer_CCLE_Notebook.ipynb demonstrates how to use the enrichrgram method to pre-calculate enrichment analysis results for a visualization.
The Enrichrgram.js library provides this functionality on the front end and works with the Clustergrammer-JS API to depict enriched terms and their associated genes as row categories. The update-row-category functionality can be extended by developers for other domain-specific problems.