Case Studies and Tutorials
Clustergrammer was developed to visualize high-dimensional biological data (e.g. genome-wide expression data), but it can also generally be applied to any high-dimensional data. Below are links to several case studies and examples using Clustergrammer to explore high-dimensional data. All examples are below are publically available through GitHub.
Visium Spatial Transcriptomics Data from 10X Genomics
![]()
We used Clustergrammer2, the plotting library bqplot, the Jupyter dashboard library voila, and the Jupyter notebook hosting service Binder to build an interactive data exploration dashboard for Visium data from the mouse brain from 10X Genomics (try dashboard: Visium-Clustergrammer2 Dashboard, code: https://github.com/ismms-himc/visium-clustergrammer2). This dashboard generates linked views of spatial tissue data and high-dimensional gene expression data - see GitHub repo https://github.com/ismms-himc/visium-clustergrammer2 for more information.
Single-cell Gene Expression and Proteomics from Human Atherosclerotic Plaques
Immune Profiling of Atherosclerotic Plaques Identifies Innate and Adaptive Dysregulations Associated with Ischemic Cerebrovascular Events (Fernandez et al.).
Our collaborators in the Giannarelli Lab used single-cell proteomics and transcriptomics to investigate the immune landscape of atheroscelerotic plaques (Fernandez et al.) and identify features of T cells and macrophages that were associated with clinical symptomatic disease state. We used Clustergrammer2 to analyze scRNA-seq and CITE-seq data as well as infer cell-cell communication pathways. Interactive notebooks can be found in the Giannarelli lab GitHub repo: Single-Cell-Immune-Profiling-of-Atherosclerotic-Plaques.
scRNA-seq Gene Expression 2,700 PBMC
![]()
![]()
Single cell RNA-seq (scRNA-seq) is a powerful method to interrogate gene expression across thousands of single cells. This method provides thousands of measurements (single cells) across thousands of dimensions (genes). Clustergrammer2 is used to interactively explore an example dataset of 2,700 PBMCs obtained from 10X Genomics. Bulk gene expression signatures of cell types obtained from CIBERSORT were used to obtain a tentative cell type for each cell. The data and code can be found on GitHub at clustergrammer2-notebooks and the notebook can be viewed and re-run on the cloud - see below.
CITE-seq 7,800 PBMC
![]()
![]()
CITE-seq (a.k.a feature barcoding from 10X genomics) is a new method that enabels researchers to simultaneously measure gene expression and protein levels in single cells. This notebook uses Clustergrammer2 to interactively explore an example dataset measuring the gene expression and surface marker proteins of 7,800 PBMCs obtained from 10X Genomics. Cell type was assigned based on unbiased hierarchical clustering of cells in surface marker space (ADTs) and transferred to cells in gene expression space. Please see the video tutorial above for more information.
Mouse Organogenesis Cell Atlas 2 Million Cells
![]()
![]()
Cao, J and Spielmann, M et al profiled gene expression from ~2 million mouse cells between 9.5 and 13.5 days of gestation. They identified 38 major cell types and measured ~25,000 genes. We generated a downsampled view of this data representing the ~1.3 million single cells (excluding ~600K suspected doublets) in the dataset by averaging expression for each cell type in each embryo, resulting in ~2,000 cell-type and embryo representative clusters. We demonstrate how Clustergrammer2 can be used to explore cell type clustering, find genes associated with cell type clusters, as well as identify genes that are differentially regulated across developmental stage. For more information, see the video tutorial above and launch or view the notebook using the badges.
CODEX Single Cell Multiplexed Imaging Dashboard
![]()
Goltsev et al used a highly multiplexed cytometric approach called CODEX to measure ~30 surface markers in spatially resolved single cells from mouse spleens. We utilized Clustergrammer2 to hierarchically cluster ~5,000 sinlge cells (from a subset of a segmented spleen image). We also used the Jupyter Widget bqplot to visualize single cell location data using voronoi plots. We then built a dasnboard using the library voila, which converts Jupyter notebooks to dashboards/web-apps, and linked our heatmap to the spatial map. This allows to interact with the Clustergrammer2 heatmap and highlight cells in the spatially resolved map. These kind of linked views are crucial for exploration of spatially resolved high-dimensional single cell data. Finally, we are running this dashboard using MyBinder. See CODEX Dashboard for code.
Cancer Cell Line Encyclopedia Gene Expression Data
![]()
![]()
The Cancer Cell Line Encyclopedia (CCLE) is a publicly available project that has characterized (e.g. genetic characterization) over 1,000 cancer cell lines. We used Clustergrammer to re-analyze and visualize CCLE’s gene expression data in the CCLE Explorer. The CCLE Explorer allows users to explore the CCLE by tissue type and visualize the most commonly differentially expressed genes for each tissue type as an interactive heatmap. The CCLE Jupyter Notebook generates an overview of the CCLE gene expression data, investigates specific tissues, and explains how to use Enrichrgram to understand the biological functions of differentially expressed genes.
Lung Cancer Post-Translational Modification and Gene Expression Regulation
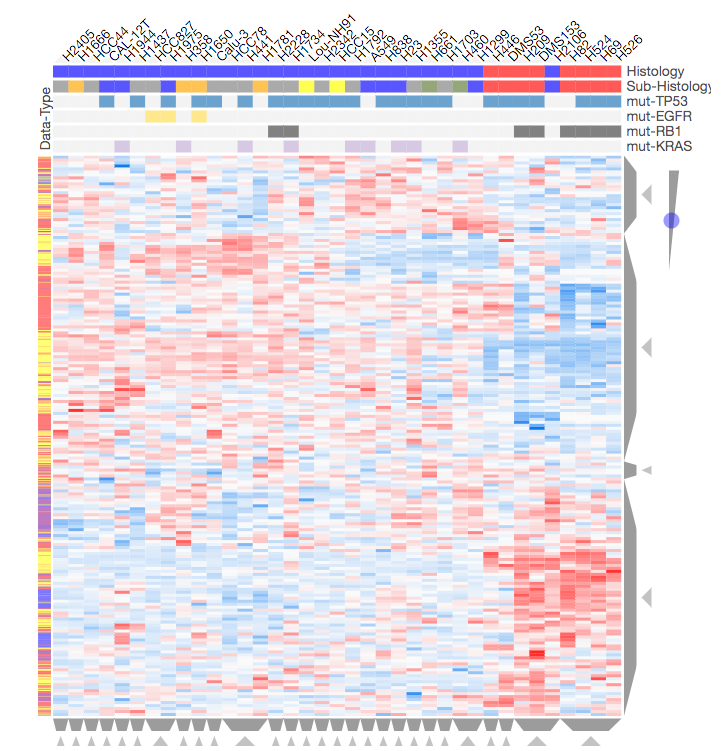
Screenshot from the CST_Data_Viz.ipynb Jupyter notebook showing hierarchical clustering of differential phosphorylation, methylation, acetylation, and gene expression data across 37 lung cancer cell lines. See the interactive Jupyter notebook CST_Data_Viz.ipynb for more information.
Lung cancer is a complex disease that is known to be regulated at the post-translational modification (PTM) level, e.g. phosphorylation driven by kinases. Our collaborators at Cell Signaling Technology Inc used Tandem Mass Tag (TMT) mass spectrometry to measure differential phosphorylation, acetylation, and methylation in a panel of 42 lung cancer cell lines compared to non-cancerous lung tissue. Gene expression data from 37 of these lung cancer cell lines was also independently obtained from the publicly available Cancer Cell Line Encyclopedia (CCLE). In the Jupyter notebook CST_Data_Viz.ipynb we:
- Visualize PTM data, gene expression data, and merged PTM/gene-expression data
- Identify co-regulated clusters of PTMs/genes in distinct lung cancer cell line subtypes
- Perform enrichment analysis to understand the biological processes involved in PTM/expression clusters
Large Network: Kinase Substrate Similarity Network

Screenshot from the Kinase Substrate Similarity Network example that demonstrates how Clustergrammer can be used to visualize a large network of kinases based on shared substrates.
Clustergrammer can be used to visualize large networks without the formation of ‘hairballs’. In the Kinase Substrate Similarity Network example we use Clustergrammer to visualize a network kinases based on shared substrate that includes 404 kinases and 163,216 links. Kinases are shown as rows and columns. For more information see the Kinase Substrate Similarity Network example.
Machine Learning and Miscellaneous Datasets
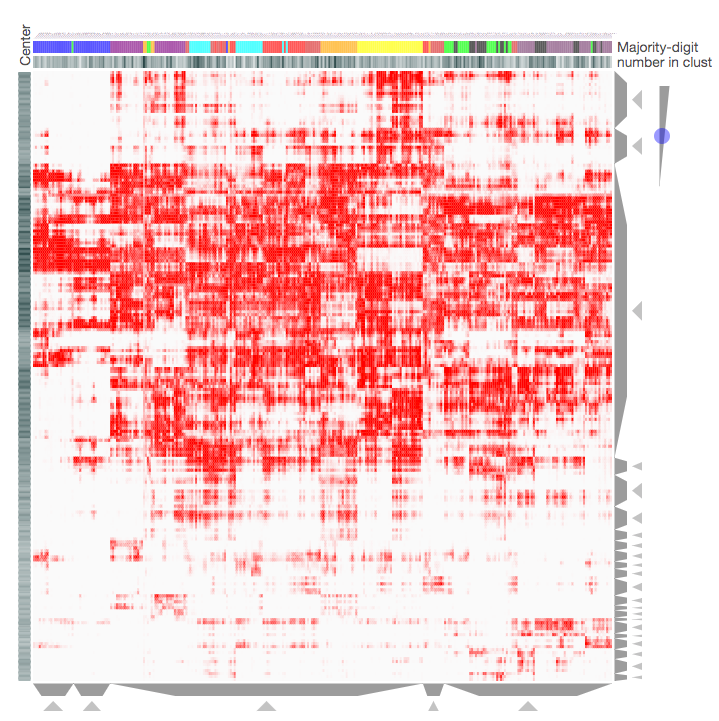
Screenshot from the MNIST Notebook that demonstrates how the Clustergrammer-Widget can be used to visualize the MNIST Data. Downsampled handwritten digits (K-means downsampled from 70,0000 handwritten digits to 300 digit-clusters) are shown as columns with digit-type categories and pixels are shown as rows. For more information see the MNIST Notebook.
Clustergrammer was used to visualize several widely used machine learning Datasets and other miscellaneous Datasets:
These examples demonstrate the generality of heatmap visualizations and enable users to interactively explore familiar Datasets.