App Integrations
Clustergrammer can be integrated into web applications to dynamically produce interactive visualizations – see Web-Development for information. Clustergrammer is currently being utilized to visualize data for the following Ma’ayan lab web applications:
Enrichr
The enrichment analysis tool, Enrichr, uses Clustergrammer to produce dynamic heatmaps of enriched terms as columns and user input genes as rows, which helps users understand the relationships between their input genes and enriched terms.
Enrichr uses the Clustergrammer-Web API to produce interactive heatmaps of enriched terms as columns and user-input genes as rows.
GEN3VA
The gene signature analysis and visualization tool, GEN3VA, uses Clustergrammer’s core libraries, Clustergrammer-JS and Clustergrammer-PY, to dynamically visualize collections of gene expression signatures collected by users from GEO as interactive heatmaps. GEN3VA also uses Clustergrammer to visualize enrichment analysis results (obtained from Enrichr) and perturbations that reverse or mimic gene expression signatures (obtained from L1000CDS2)
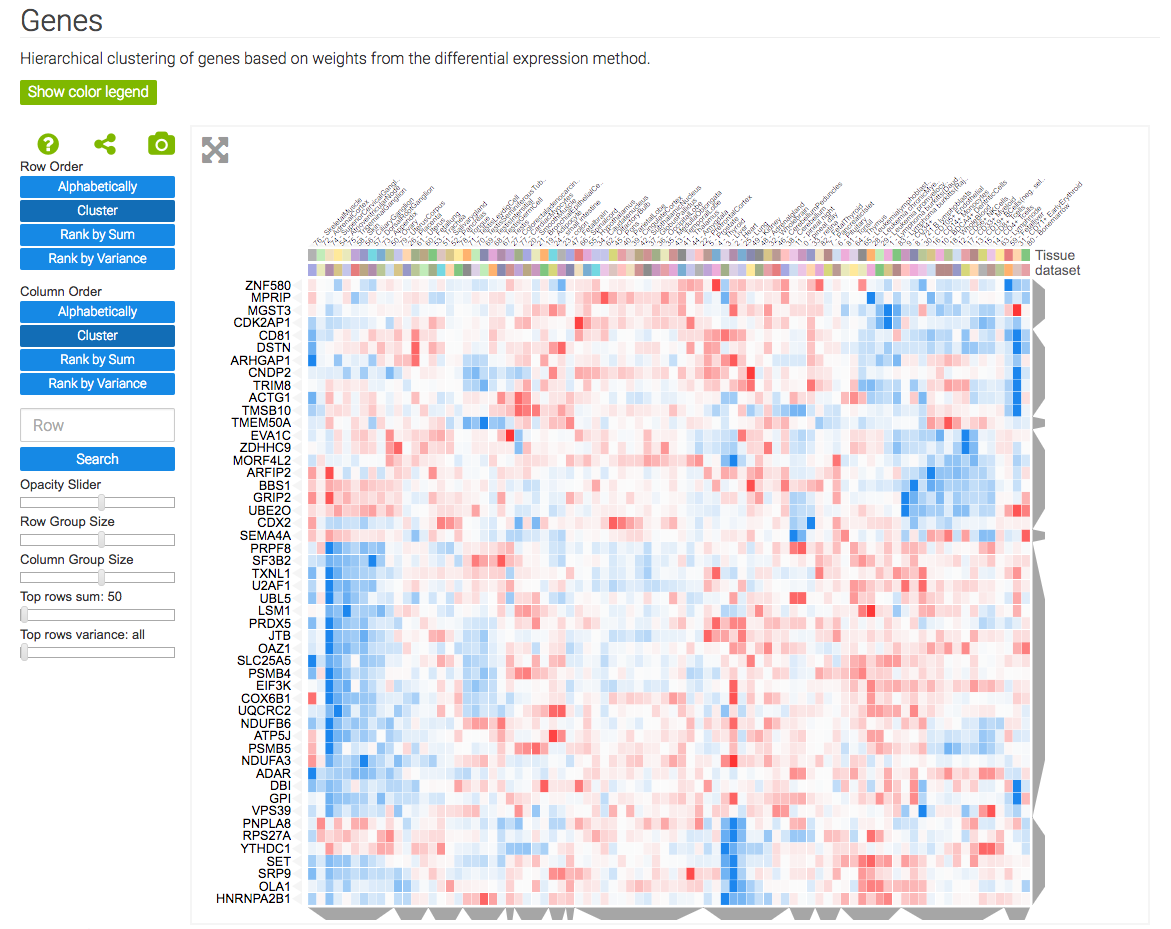
GEN3VA uses Clustergrammer’s core libraries, Clustergrammer-JS and Clustergrammer-PY, to visualize gene expression signatures and enrichment analysis results.
L1000CDS2
L1000CDS2 uses the Clustergrammer-Web API to produce interactive heatmaps of perturbagen gene signatures that mimic or reverse an input gene signature. This can be useful for users who are interested in the specific genes that are differentially regulated by the identified perturbagens.
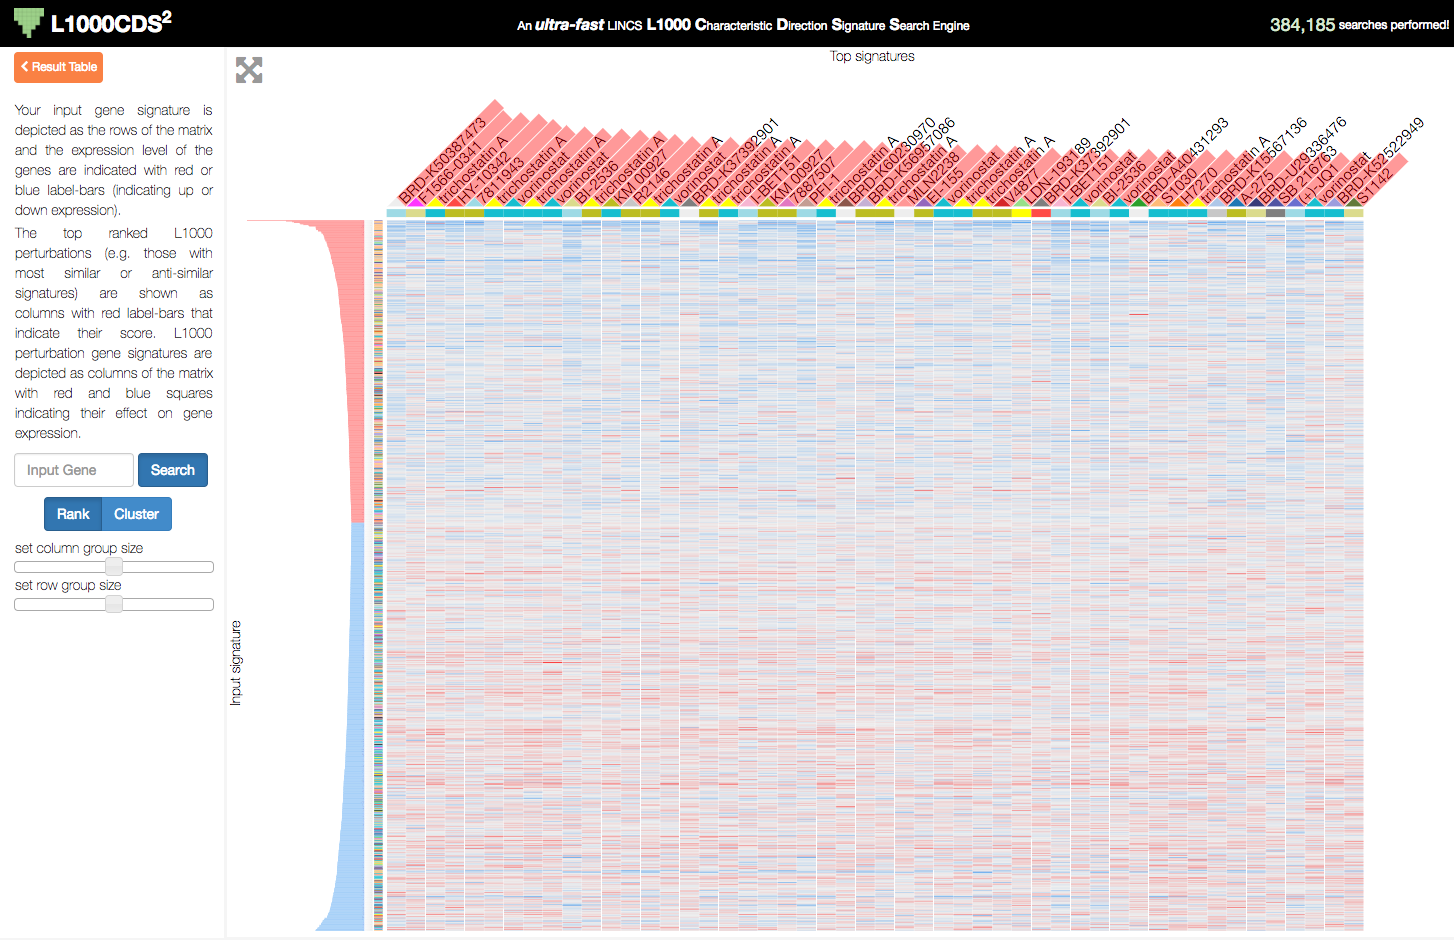
L1000CDS2 uses Clustergrammer to produce interactive visualizations of input gene signatures and perturbation signatures that mimick or reverse the user’s user-input signature. A users’s input signature is shown as rows with gene expression levels shown as row-bars (red/blue for up/down expression) and perturbations found to mimic/reverse their signature are shown as columns in the heatmap.
Harmonizome
The Harmonizome uses the Clustergrammer-Web API to generate visualizations of curated biological datasets as heatmaps and adjacency matrices (e.g. to depict networks). The Harmonizome also uses the Clustergrammer to visualize the amount of biological information that is available for different families of genes in the Harmonogram
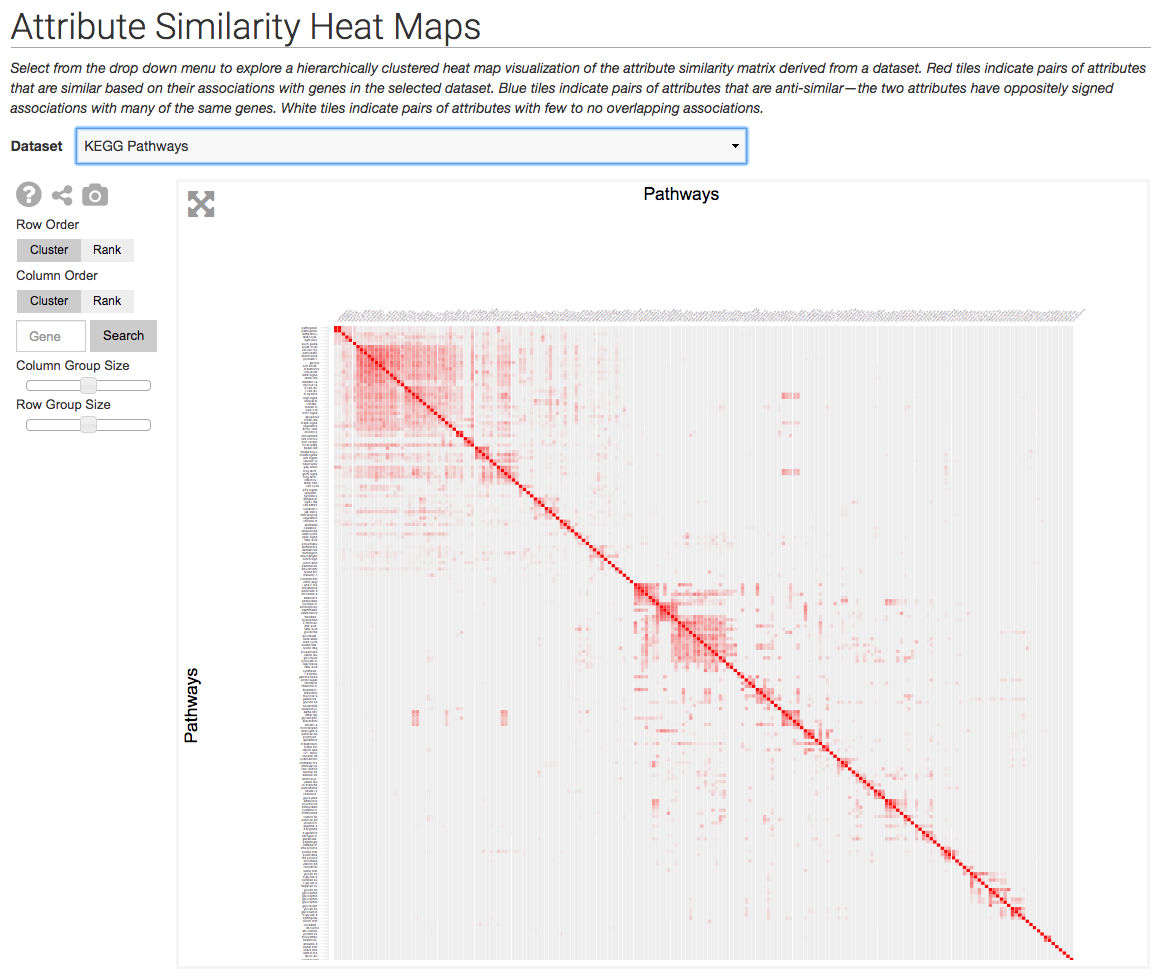
The Harmonizome uses Clustergrammer to visualize datasets as heatmaps and similarity matrices (e.g. similarity of attributes based on shared genes). Above is an example similarity matrix of KEGG pathways.