Clustergrammer-Widget


See Clustergrammer2 for Latest Widget
Clustergrammer2 is the new WebGL widget that is being developed to handle larger datasets (e.g. scRNA-seq data). This widget will be the focus of future development and feature additions. The original Clustergrammer-Widget will still be maintained, but users are encouraged to migrate to Clustergrammer2.
About Clustergrammer-Widget
Jupyter notebooks are ideal for generating reproducible workflows and analysis. They are also the best way to share Clustergrammer’s interactive visualizations while providing context, analysis, and the underlying data to enable reproducibility (see Sharing with nbviewer). The Clustergrammer Widget enables users to easily produce interactive visualizations within a Jupyter notebook that can be shared with collaborators (using nbviewer). Clustergrammer-Widget can be used to visualize a matrix of data from a file or from a Pandas DataFrame (see Matrix Formats and Input/Output for more information). The library is free and open-source and can be found on GitHub.
Clustergrammer has been applied to a wide variety of biological and non-biological data. See the Jupyter notebook examples below and Case Studies and Tutorials for more information:
- Running_clustergrammer_widget.ipynb
- DataFrame_Example.ipynb
- CCLE Jupyter Notebook
- Lung Cancer PTM and Gene Expression Regulation
- Single-Cell CyTOF Data
- MNIST Notebook
- USDA Nutrient Dataset
- Iris Dataset.ipynb
Clustergrammer can be used as an interactive widget within a Jupyter notebook and shared using nbviewer (see Running_clustergrammer_widget.ipynb example).
Jupyter Widget Dependencies
Clustergrammer-Widget works with Python 2 and 3.
Installation
To use the Clustergrammer-Widget users need to install: Python, Jupyter notebook, the widget dependencies (see Jupyter Widget Dependencies), and ipywidgets version 6.0.0 (to save the notebook with widgets, version 6.0.0 is recommended). Users can install Anaconda, a Python distribution that includes the Jupyter notebook as well as other scientific computing libraries, to easily obtain the necessary dependencies (except ipywidgets version 6.0.0). The clustergrammer_widget can the be installed (with pip) and enabled using the following commands:
pip install --upgrade clustergrammer_widget
jupyter nbextension enable --py --sys-prefix widgetsnbextension
jupyter nbextension enable --py --sys-prefix clustergrammer_widget
Clustergrammer-Widget Workflow Example
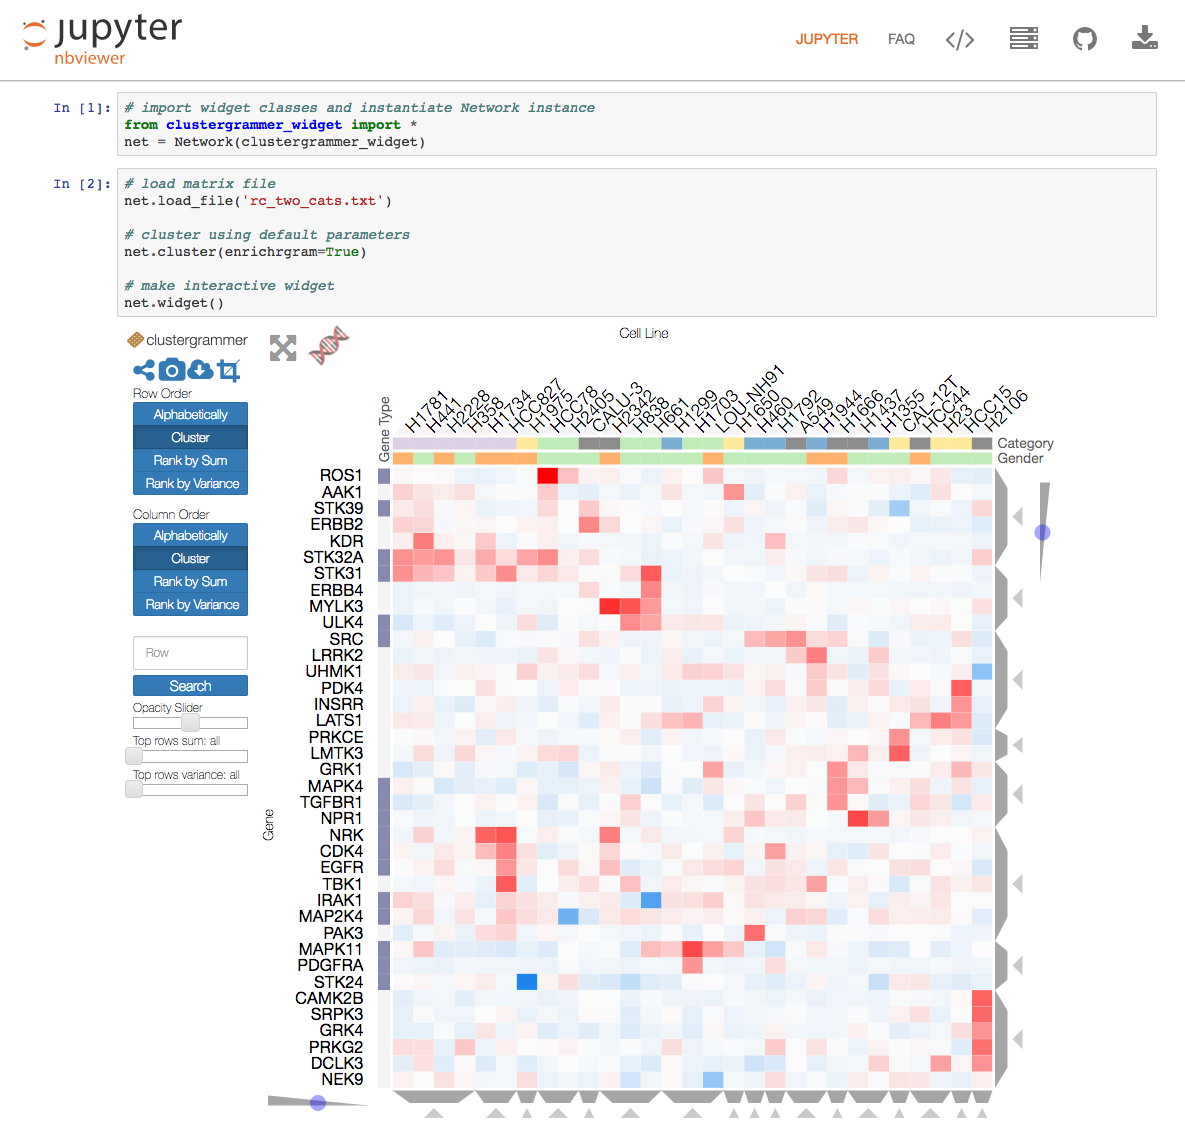
The Jupyter notebook Running_clustergrammer_widget.ipynb (which is rendered using nbviewer) shows how to visualize: a matrix from a file and a Pandas DataFrame. The following examples are taken from this notebook.
Here we are visualizing a matrix of data from a file (e.g. rc_two_cats.txt). We start by instantiating the Network object, net, and passing it the widget class, clustergrammer_widget as an argument. The net object is used to load data, filter, normalize, cluster, and render the widget. For more information about the Network class, refer to the Clustergrammer-PY API.
Load Data from File
# make imports and instantiate a Network instance with the widget class as an argument
from clustergrammer_widget import *
net = Network(clustergrammer_widget)

# load matrix file
net.load_file('rc_two_cats.txt')

# cluster using default parameters
net.cluster()

# make interactive widget
net.widget()
General Purpose DataFrame Viewer
Clustergrammer-Widget can also be used as a general purpose Pandas DataFrame viewer. Below is an example of how to visualize a Pandas DataFrame, df, by loading it into the net object:
# load DataFrame
net.load_df(df)

# cluster using default parameters
net.cluster()

# make interactive widget
net.widget()
Loading new data into net removes any old data, which allows the net object to be easily reused within the same notebook.
Filtering, Downsampling, and Normalizing
The net object can also be used to filter and normalize your data before visualizing (note that filtering and normalization are permanent and irreversible). The example below performs Z-score normalization on the columns, filters to keep the top 200 rows based on their absolute value sum, calculates clustering, and finally renders the widget:
# Z-score normalize columns
net.normalize(axis='col', norm_type='zscore', keep_orig=True)

# filter for the top 200 rows based on their absolute value sum
net.filter_N_top('row', 200, 'sum')

# cluster using default parameters
net.cluster()

# make interactive widget
net.widget()
Two-way Widget Communication
Jupyter widgets enable both back-end to front-end communication (e.g. Python kernel to JavaScript) and front-end to back-end (e.g. JavaScript to Python kernel). Clustergrammer-Widget uses front-end to back-end communication to enable users to export their modified matrix (e.g. cropped matrix) to the Python kernel as a DataFrame. This can be used to select a cluster of interest (e.g. by Cropping or using the Interactive Dendrogram) and pass this cluster to a new DataFrame. Alternatively, this can be used to export data to a DataFrame after running front-end enrichment analysis using Enrichrgram. See the df_widget method below for an example:
# After modifying the visualization (e.g. dendrogram cropping) we can export the
# modified matrix to the back end using the df_widget method
df_new = net.df_widget()
Clustergrammer-PY API
For more information about the Network object and additional options refer to the Clustergrammer-PY API.
Sharing with nbviewer
To enable rendering interactive widgets on nbviewer you must have ipywidgets version 6 or later installed and use the “Save Notebook with Widgets” action in the Widgets menu in the Jupyter notebook (see ipywidgets Rendering Interactive Widgets on nbviewer documentation and screenshot below):
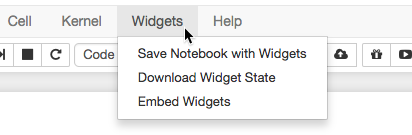
Users can save notebooks with interactive HTML widgets using the “Save Notebook with Widgets” action in the Jupyter Notebook Widgets menu as shown here. ipywidgets version 6 or later must be installed in order to enable this feature.
Clustergrammer-Widget Development
Clustergrammer-Widget’s source code can be found in the clustergrammer-widget GitHub repo. Clustergrammer-Widget is built using the ipywidgets framework (using the cookie cutter template).
Please Contact Nicolas Fernandez and Avi Ma’ayan with questions or use the GitHub issues feature to report an issue.